Meaningful Tennis Workload: Acceleration based measures and smart feedback
Want to quantify how hard a tennis player has trained on court? BreakAway has developed automated feedback from GPS to compare tennis sessions directly with ‘apples v apples’ metrics. These metrics provide insights to coaches and trainers on how to target specific physical qualities and prepare for match intensity during on-court training, enabling physical and tennis training to become fully integrated.
25 May 2023
By Rapha Brandon
Elite Tennis has some of the very best athletes in the world displaying power, agility, and endurance at the same time as precision technical skills. It’s a tough sport to make it as a professional, and standards of physical performance are increasing. Attention is naturally drawn to tools that will help improve athletic ability, and so GPS/Accelerometer devices are gaining interest amongst professional players and their support teams.
At BreakAway, the performance questions we’ve been posed by some of the world’s top players and their trainers are: 1) How can we make training meet the demands of match intensity? And 2) How can we coordinate the weekly training programme, so that the micro-cycle of on-court tennis is in sync with the fitness (S&C) training?
There is an opportunity to generate insights from GPS devices to help answer these questions. Armed with this know-how tennis coaches and trainers could take physical preparation up a level for their players. This blog outlines the scientific and practical approach we’ve been taking and the solutions we are developing.
We began by working out how to deliver ‘tennis workload’ metrics that quantify volume and intensity, specific and relevant for tennis. In locker room language, this means you can put numbers on ‘how much training the athlete did’ and ‘how hard they did it’.
In tennis, it is probably fair to assume that the ‘load’ is less about running distance, and more about continual ‘positioning’ accelerations and decelerations combined with whole body ‘swinging’ movements 1. Analysis using GPS devices 2 shows the majority of movement as occurring in the -1 to 1 m.s-2 acceleration/deceleration range.
Catapult’s PlayerLoad (PL) 3 metric is a generic measure of load for athletes, independent of distance travelled, that is useful in court-based high-level movement sports, like tennis. Based upon the rationale and evidence above, it would seem a good choice, as a foundation for tennis workload analysis.
We have created ‘Tennis Time’, ‘Tennis Load’ and average acceleration (‘AveAcc’) outputs from periods of tennis activity only, by using the Catapult’s PL raw data from sessions. We performed video analysis with corresponding accelerometer and GPS data to establish there is a very close match between the time windows seen on video of rallying, serving and other tennis movements, with the activity windows derived from PL.
For example, if a tennis player plays a set of ‘points’ this results in approximately 60 bursts of tennis activity, representing a serve, or service receive, and/or a rally. The more shots played, then the longer the rally ‘Tennis Time’. The more movement and racquet swings the player has to make, then the higher the rally ‘Tennis Load’. The more running and change of direction distance covered, then the rally ‘AveAcc’ increases.
Tennis Time and Tennis Load are obvious volume measures, allowing coaches and trainers to put a number on the amount of tennis performed. AveAcc has been used in football (soccer) workload analysis and is valuable as it represents all the changes in direction and speed performed by the athlete4. In football, AveAcc values are related to higher levels of post training muscle soreness, suggesting it represents workload5. The movement demands of tennis are mostly about continual re-positioning, with less need of high intensity accelerations and sprints of any significant distance. Therefore AveAcc seems an appropriate method to capture the mechanical and metabolic demand of tennis , and can be used as the ‘intensity’ metric, representing how hard the tennis player has had to move around the court.
In sum, BreakAway can quantify ’how much’ and ‘how hard’ players have worked during tennis training sessions, rally by rally. And, we can bring that to life with a visualisation of the session.


Importantly, these metrics are comparable between sessions, regardless of how the session was constructed and any variations in drills, rest times, or periods of non-tennis activity. We avoid averaging values of Time, Load and AveAcc across the whole session and instead calculate values directly from tennis activity periods. BreakAway processes this automatically, saving the trainer time clipping and editing the uploaded sessions from the device. Therefore, tennis coaches and trainers have an ‘apples versus apples’ value for the session Time, Load and AveAcc scores, which they can use immediately to evaluate and compare training sessions.
Our method also allows high intensity rallies to be identified and quantified, and enables specific drill analysis and comparisons. For example, our session visual shows each ‘tennis activity’ along a timeline. Each bar is a rally or activity, the height of the bars is the volume (PL) and the colours represent intensity bands of AveAcc, with orange and red being the high values. This brings to life the training session, and trainers and coaches can review it to see how hard the player was working in the different sections of the session. The examples above show two very different levels of intensity, from very similar Tennis Time sessions. The top session took 135 mins in total to achieve 37 mins of Tennis Time. The first half is warming up and then performing specific drills, with progressive intensity. The player then warms up their serve (shown by the block of low intensity low load activity bars in the middle). The second half of the session is points play, where the player has regular high intensity movement levels. In contrast, the bottom session took 75 mins to complete the 37 mins of Tennis Time, and is mostly low intensity rallying, with some service / receive practice to finish.
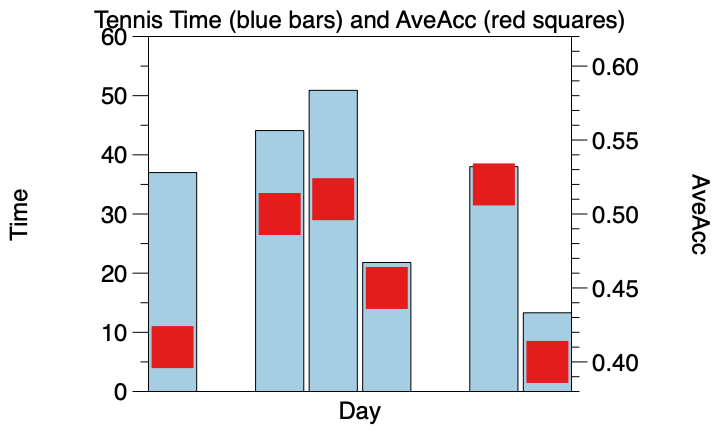
Tennis coaches and trainers can use the Breakaway metrics and visuals to plan and periodise training sessions. For example higher volume, lower intensity sessions can be coordinated with the off-court S&C programme to focus days on the player’s 'conditioning’, or endurance. High intensity tennis movement sessions can be coupled with speed/power training to create ‘explosive’ days where the neuro-muscular system is challenged more. The example graph shows the kind of analysis possible, to summarise the volume and intensity of on-court tennis training sessions across a week. This simple, but meaningful graphic shows objectively the variation in volume (Tennis Time) and intensity (AveAcc) across the tennis sessions. The sessions can be fairly compared with each other for reasons explained above, via an automated tool, requiring no additional processing.
Finally, players can use our solution to capture volume and intensity metrics from specific sessions where they play competitive points against each other. When this is done at a high intensity against a suitable opponent, these numbers generate match specific benchmarks. Once players, coaches and trainers know the target levels of movement intensity required to perform in competition, then training can be planned and adjusted to ‘progressively overload’ these demands, and ensure the player is prepared effectively.
It is good to remember that ‘not everything that can be counted, counts’. Applied performance scientists working with athletes must choose the most meaningful metrics available from the wide range of outputs produced from GPS devices. This tennis solution aims to automatically deliver measures that represent the volume and intensity athletes perform specifically for this sport.
As a result Tennis coaches and trainers can 1) accurately quantify and fairly compare ‘how hard’ and ‘how much’ the player has worked across tennis training sessions; 2) use this information to take their planning and programming to the next level and 3) develop a greater understanding of match specific loading demands, enabling tennis coaches and trainers to develop their on-court training methods to design smarter and more individualised preparation.
For more information please contact raphael@breakawaydata.com.
References:
Marutani et al. https://doi.org/10.3389/fphys.2023.1161182
Gale-Ansodi et al. https://doi.org/10.1080/24748668.2017.1406780
https://www.catapultsports.com/blog/fundamentals-playerload-athlete-work
Kovacevic et al. https://www.frontiersin.org/articles/10.3389/fspor.2021.802014/full
Delaney et. al. https://doi.org/10.1519/JSC.0000000000001849